ACM Trans. Graph. (Proceedings of SIGGRAPH 2021)
Optimizing Dyadic Nets
Abdalla G. M. Ahmed
Peter Wonka
KAUST, KSA
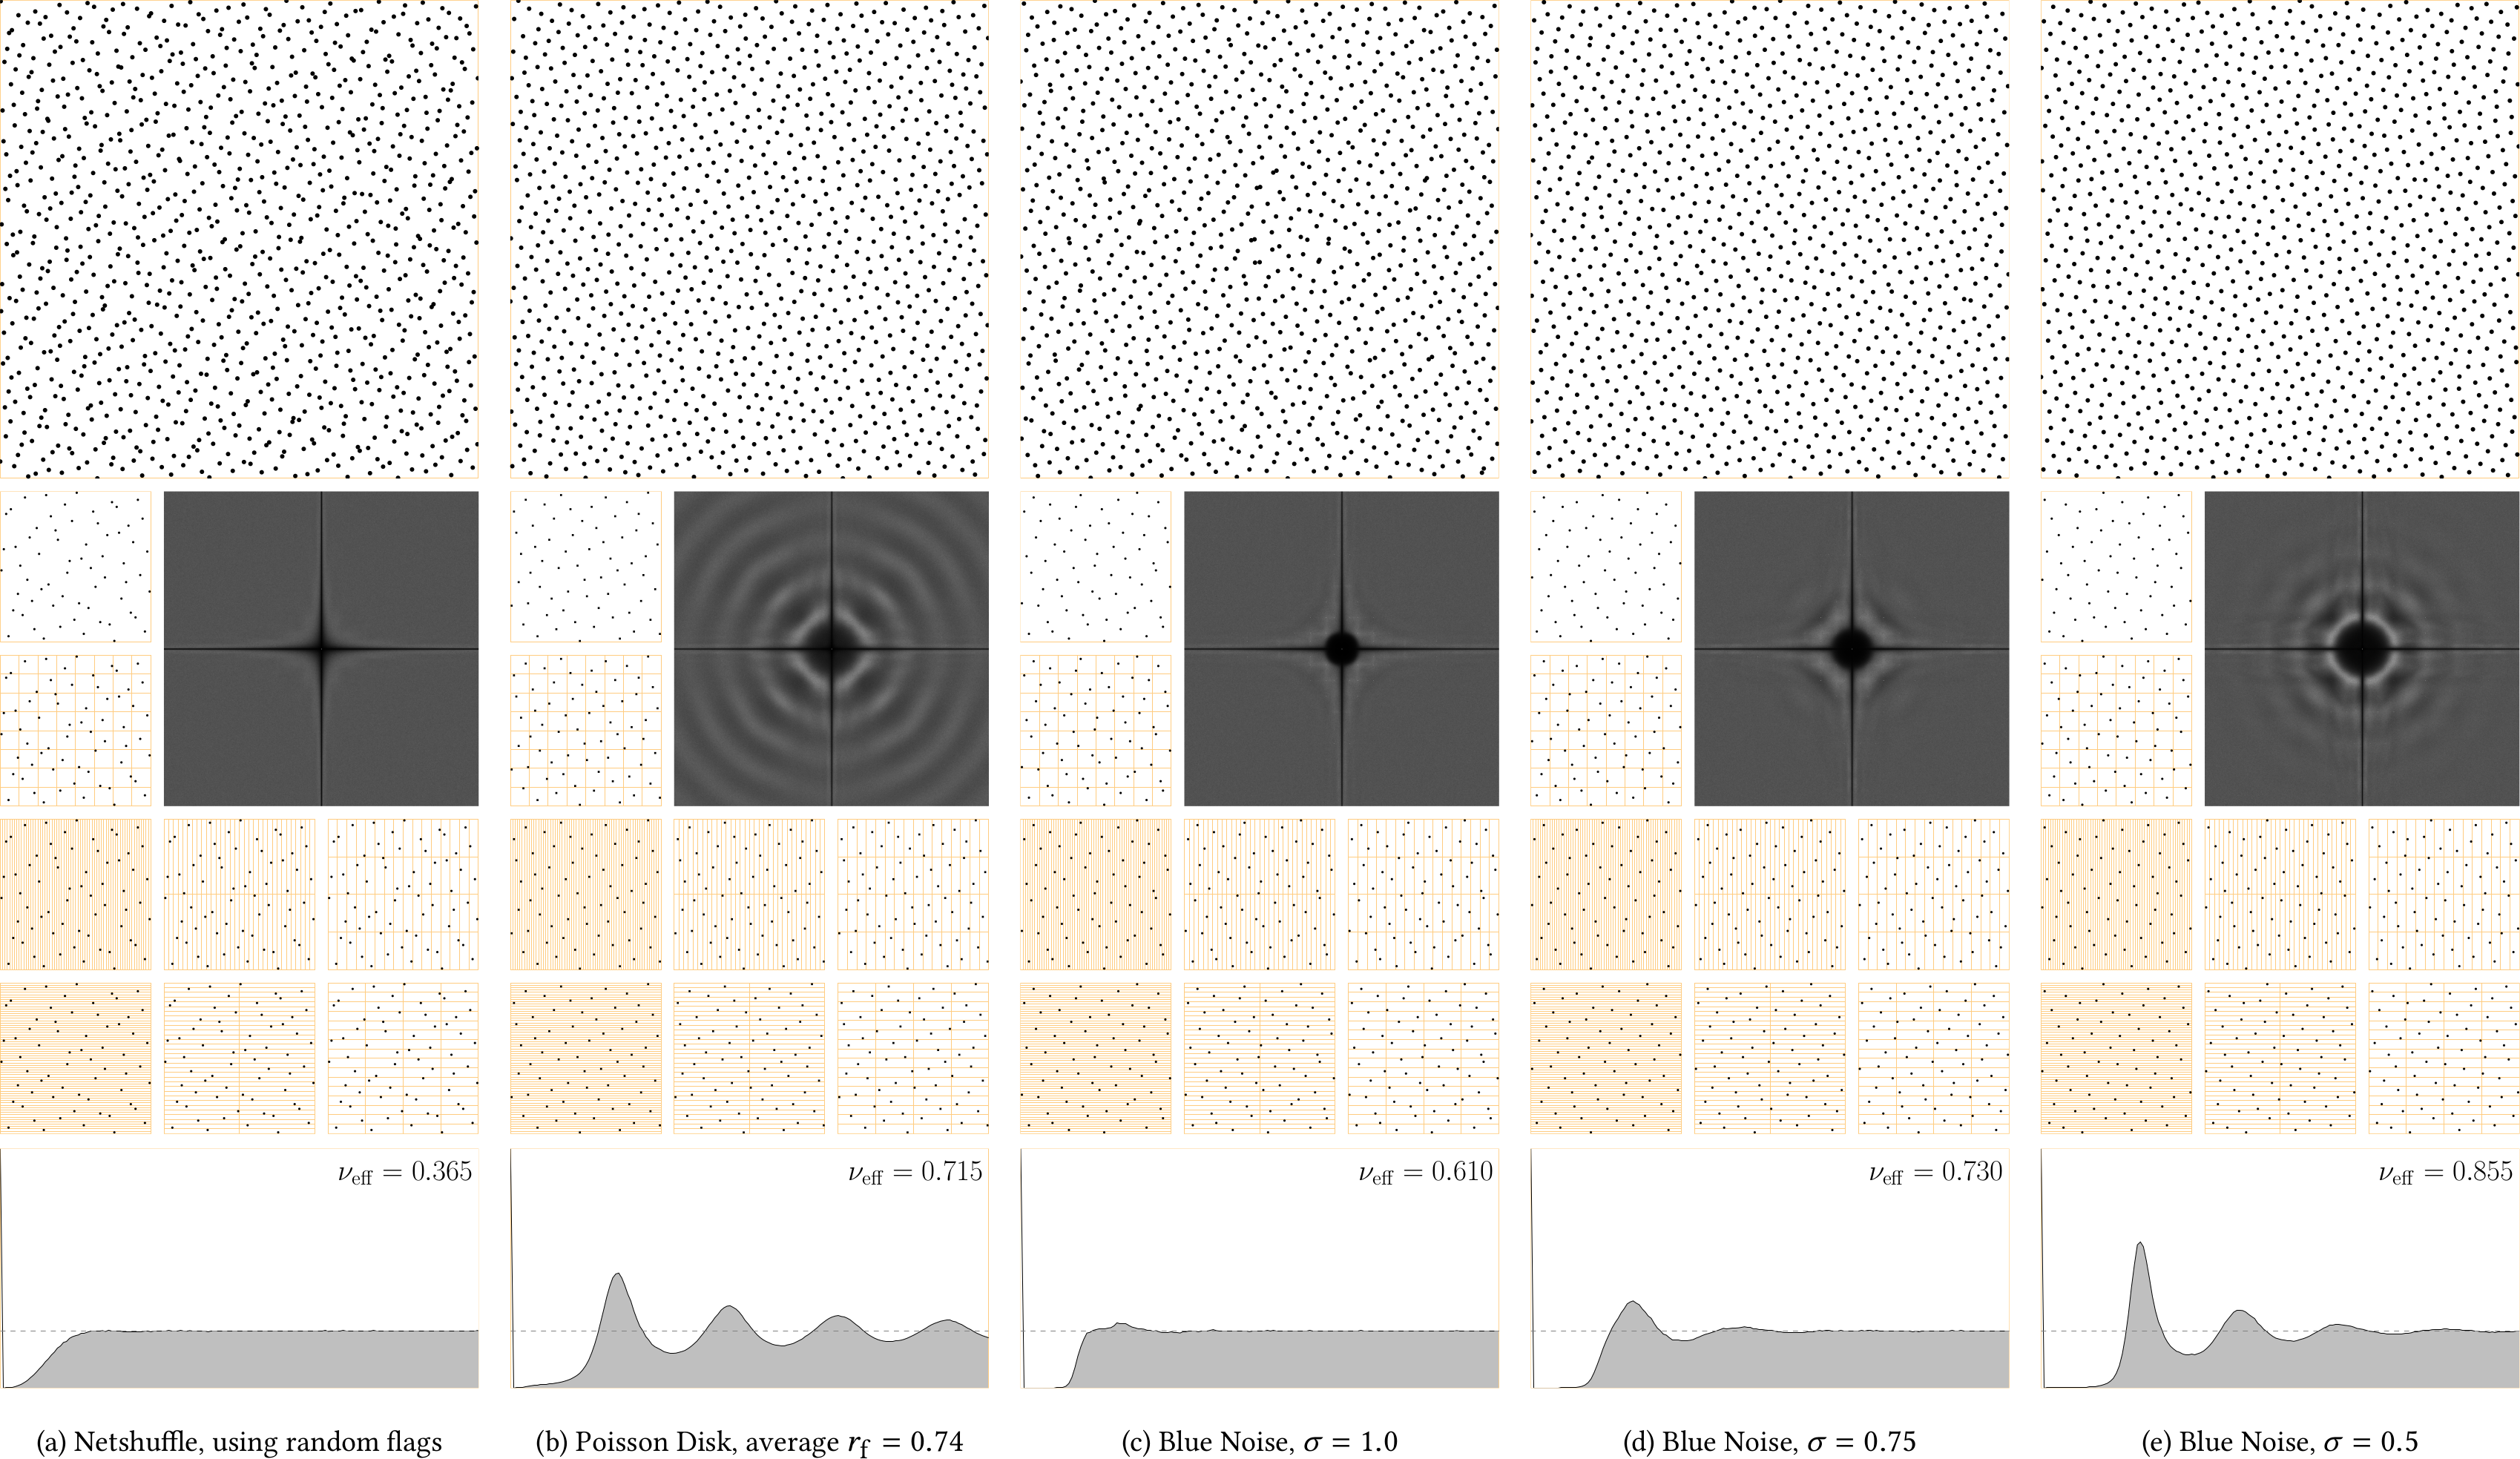
Various (0, m, 2)-nets with different spectral profiles produced by our (a) Netshuffle and (b-e) Netoptimize algorithms. In each of the five columns, the plot in the top shows a 1024-point set. The middle-right image shows the corresponding frequency power-spectrum, and the bottom plot shows its radial average, both obtained by averaging 100 periodograms of 4096-point sets, using the standard PSA tool with the default settings. The eight subplots show a 64-points net of the same profile, demonstrating the dyadic net property: that the points are stratified over all the elementary intervals. The top set is similarly stratified over all the 11 possible stratifications. The Netshuffle version in (a) is close to Owen's scrambling, but is free of the grid-like artifacts typically seen in its spectrum. The blue noise profiles are obtained by adjusting the ς parameter of a Gaussian optimization process.
Abstract
We explore the space of (0, m, 2)-nets in base 2 commonly used for sampling. We present a novel constructive algorithm that can exhaustively generate all nets — up to m-bit resolution — and thereby compute the exact number of distinct nets. We observe that the construction algorithm holds the key to defining a transformation operation that lets us transform one valid net into another one. This enables the optimization of digital nets using arbitrary objective functions. For example, we define an analytic energy function for blue noise, and use it to generate nets with high-quality blue-noise frequency power spectra. We also show that the space of (0, 2)-sequences is significantly smaller than nets with the same number of points, which drastically limits the optimizability of sequences.
Interactive Demos
Example Dyadic Nets:
In this demo, you may interact with 16-point (0, 4, 2)-nets,
and browse the 232 set of distinct ones, identified by
the first four bits of point coordinates.
We show the points as square blocks to indicate the
degree of freedom in defining the trailing bits while
preserving the identity of the net.
The flow diagram visualizes the Netshuffle algorithm.
The nodes are colored to make it easier to follow the flow, and to
identity the dyadic distribution of each coordinate over the other.
The following interactions are available:
- Click/tap the flag bits in the flow diagram, or click/tap any pair of strata in the five plots, to swap the associated points. Please note how the strata are associated with the flow diagram. Please also note that no point leaves its designated stratum in any plot.
- Directly enter the net index in hexadecimal in the net index edit field, observing to add leading zeros to make eight digits.
- Press the trace direction button to choose which coordinate you want to trace its distribution over the other.
Rendering Comparison:
In this demo you can compare rendering results of our Blue Nets sampler to state-of-the-art LD samplers; namely, (0, 2)-Sequence, Sobol, and Halton.
The following interactions are available:
- Click one of the thumbnails to change the rendered scene.
- Move the mouse or touch-drag to reveal different parts of the four renderings.
- Use the mouse wheel to change the sampling rate.
- Check/uncheck "Swap Top Renderings" so that you can compare currently diagonal renderings side by side.
Downloads
 |
Get for free at ACM digital library
|
|
Source Code ZIP (11 KB) |
|
|
Pre-Optimized Blue Nets ZIP (70 KB) |
Bibtex
TBA
Acknowledgments
Thanks to the anonymous reviewers for the valuable comments. Thanks to Mohanad Ahmed for his insightful discussions.